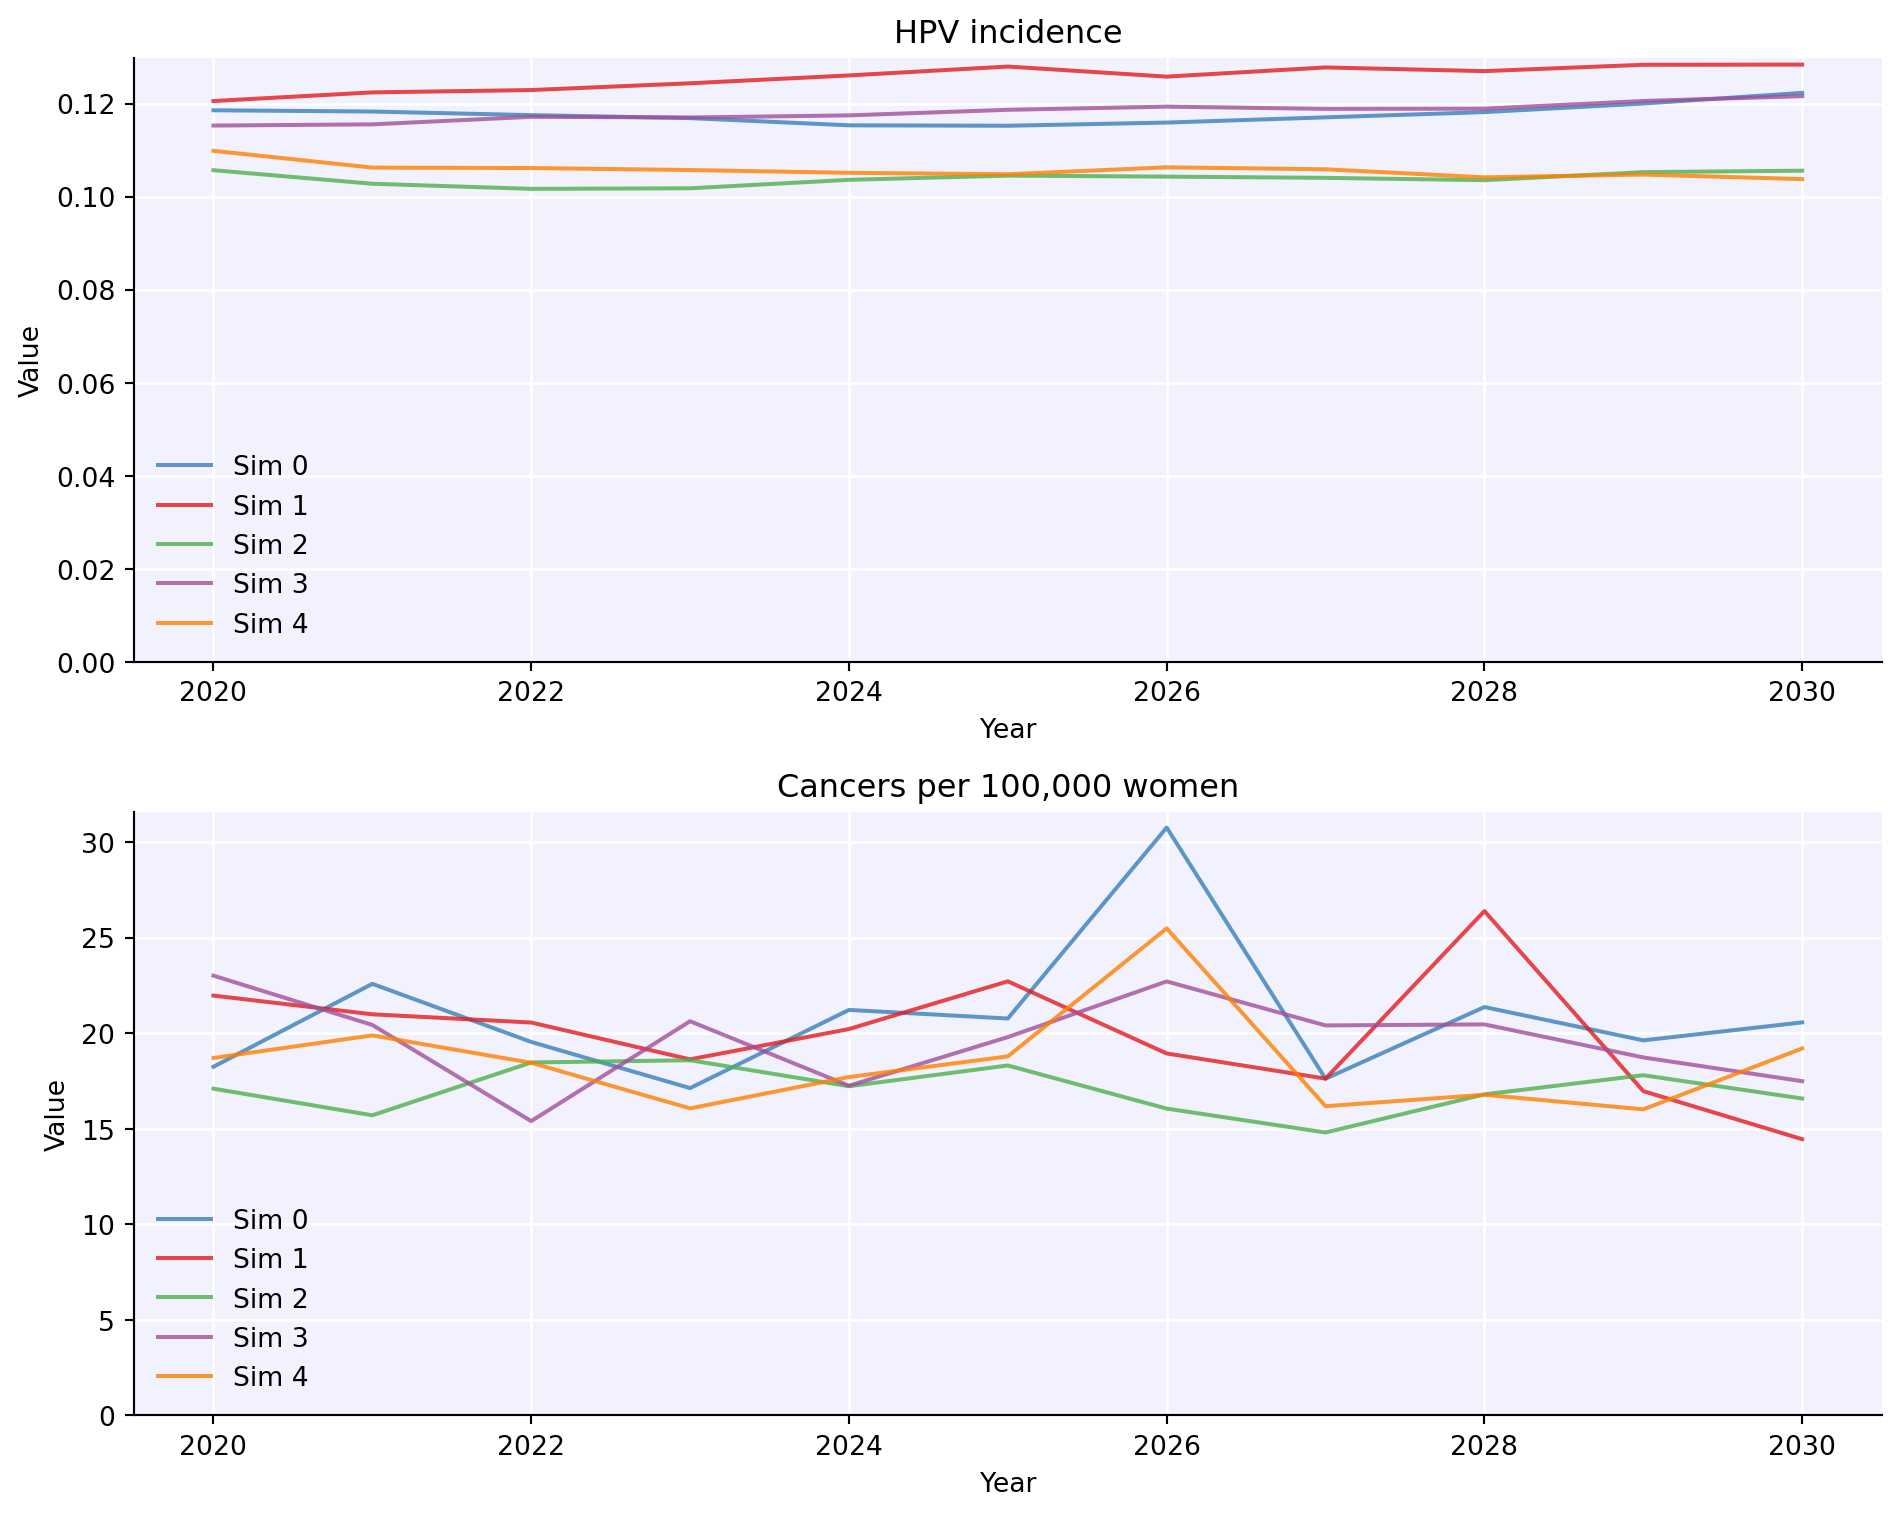
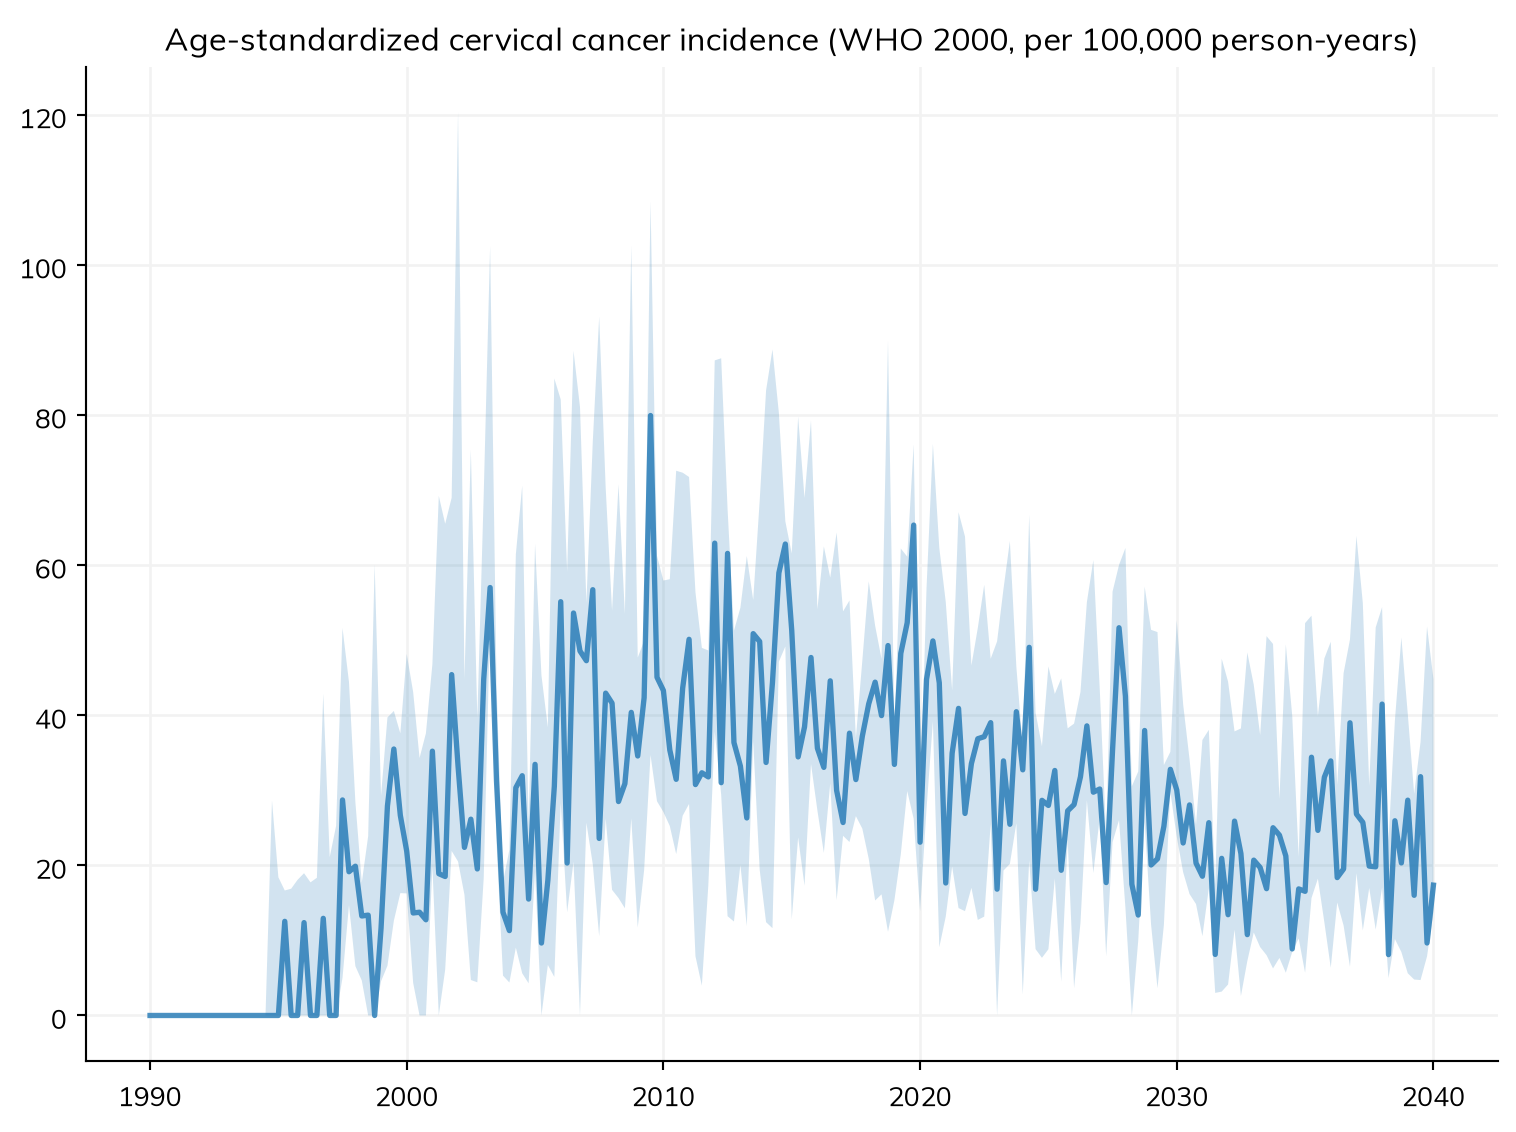
A single run tells you very little, because cervical cancer is rare and every run uses different random numbers. In this tutorial we run the same model five times to see how much of the result is noise, then compare three vaccination coverage levels with uncertainty bands around each one.
How much of this is noise?
Give ss.MultiSim one sim and a number of runs, and it makes that many copies with different random seeds:
Five lines, one model. The spread between them is the stochastic noise floor of this configuration: any difference between two scenarios smaller than this spread is not a result.
The individual runs are in msim.sims:
for s in msim.sims:print(f'seed {s.pars.rand_seed}: {float(s.results.all_hpv.cum_cancers[-1]):>10,.0f} cancers')
Two things change after this call. First, median() rewrites the MultiSim in place — the individual runs are still in msim.sims, but msim.results now holds the reduced summary. Second, the reduced results are a flat list with module-prefixed names, so all_hpv.cum_cancers becomes all_hpv_cum_cancers, and each one carries .low and .high:
r = msim.results['all_hpv_cum_cancers']print(f'Cancers by 2040: {float(r[-1]):,.0f} 'f'(10-90%: {float(np.asarray(r.low)[-1]):,.0f} to {float(np.asarray(r.high)[-1]):,.0f})')
Cancers by 2040: 1,090,283 (10-90%: 779,869 to 1,120,942)
Prefer median() over mean() for cancers, infections and prevalence. These are not normally distributed across seeds, so a mean plus or minus two standard deviations is not a 95% interval and its lower edge can fall below zero.
Compare vaccination coverage levels
Write a function that builds one sim, then build every combination you want and hand them all to ss.parallel. Here we cross three coverage levels with five seeds, and run to 2060 so the vaccinated girls reach the ages where cervical cancer occurs:
LONG =dict(PARS, stop=2060)COVERAGES = [0.0, 0.5, 0.9]N_SEEDS =5def make_sim(seed, coverage):"""One sim for a given random seed and vaccination coverage."""return hpv.Sim(**LONG, rand_seed=seed, label=f'coverage={coverage:.0%}', interventions=[hpv.routine_vx( product='bivalent', prob=float(coverage), age_range=[9, 14], start_year=2010, )], )sims = [make_sim(seed=s, coverage=c) for c in COVERAGES for s inrange(N_SEEDS)]msim = ss.parallel(*sims, verbose=0)
Now group them by coverage level and reduce each group on its own:
years = np.asarray(msim.sims[0].results.timevec.years)i2055 =int(np.argmin(abs(years -2055)))by_coverage = {}for cov in COVERAGES: group = ss.MultiSim([s for s in msim.sims if s.label ==f'coverage={cov:.0%}']) group.median() by_coverage[cov] = group asr = group.results['all_hpv_asr_cancer_incidence']print(f'coverage={cov:>4.0%} incidence in 2055: {float(asr[i2055]):5.1f} 'f'({float(np.asarray(asr.low)[i2055]):.1f} to 'f'{float(np.asarray(asr.high)[i2055]):.1f}) per 100,000')
coverage=  0%  incidence in 2055:  20.7 (10.6 to 39.9) per 100,000
coverage= 50%  incidence in 2055:   0.0 (0.0 to 8.9) per 100,000
coverage= 90%  incidence in 2055:   5.6 (2.2 to 17.8) per 100,000
Read the bands, not just the medians. Where two scenarios’ bands sit clear of each other, the difference between them is a result. Where they overlap, it is not — at this population size and with five seeds those two scenarios are indistinguishable, however different their medians look. Either report that as the answer, or raise n_agents and N_SEEDS until the bands separate.
One thing that will catch you out
Running many sims sends each one to a separate process, so the sims that come back are copies, not the objects you put in. Always read results from msim.sims, never from the list you passed to ss.parallel. Building a MultiSim from sims you have already run yourself is the one case where the two are the same objects.
A larger worked sweep, using sc.parallelize so the sims are built in parallel as well as run in parallel, is in examples/m07_uq_sweep.py.