HPV spreads through sexual partnerships, and cervical cancer appears decades later in women who are still alive to develop it. Both depend on getting the population right. In this tutorial we build a South Africa population, check its age structure against the real one, and look at the partnerships the model formed.
What location gives you
HPVsim ships UN World Population Prospects 2024 data for every country, covering 1950 to 2100:
the single-year age and sex distribution, used to create the starting population;
the crude birth rate, used to add newborns each year;
age- and sex-specific mortality from the abridged life tables, used to remove people.
Passing location='south africa' loads all three, and also sets the total population so results come out at real national scale rather than per 2,000 simulated people. Country names are case-insensitive.
Sexual behavior is not loaded per country. Every location starts from the same default partnership parameters (hpv.NetworkPars), because HPVsim ships no per-country network calibration. If you are modeling a specific country, those parameters are among the first things you will want to calibrate.
The population changes size over the run, driven by births, deaths, and the migration module that keeps the simulated age structure pinned to the WPP trajectory:
print(f'Alive in 1990: {float(sim.results.n_alive[0]):>12,.0f}')print(f'Alive in 2020: {float(sim.results.n_alive[-1]):>12,.0f}')print(f'Net immigration over the run: 'f'{float(sim.results.agemigration.new_immigrants.sum() - sim.results.agemigration.new_emigrants.sum()):,.0f}')
Alive in 1990:   40,098,213
Alive in 2020:   59,835,780
Net immigration over the run: -623,080
South Africa’s recorded population over these thirty years grew from roughly 38 million to roughly 59 million, so compare against that. If your run is an order of magnitude away, location did not take effect.
Check the age structure against the real one
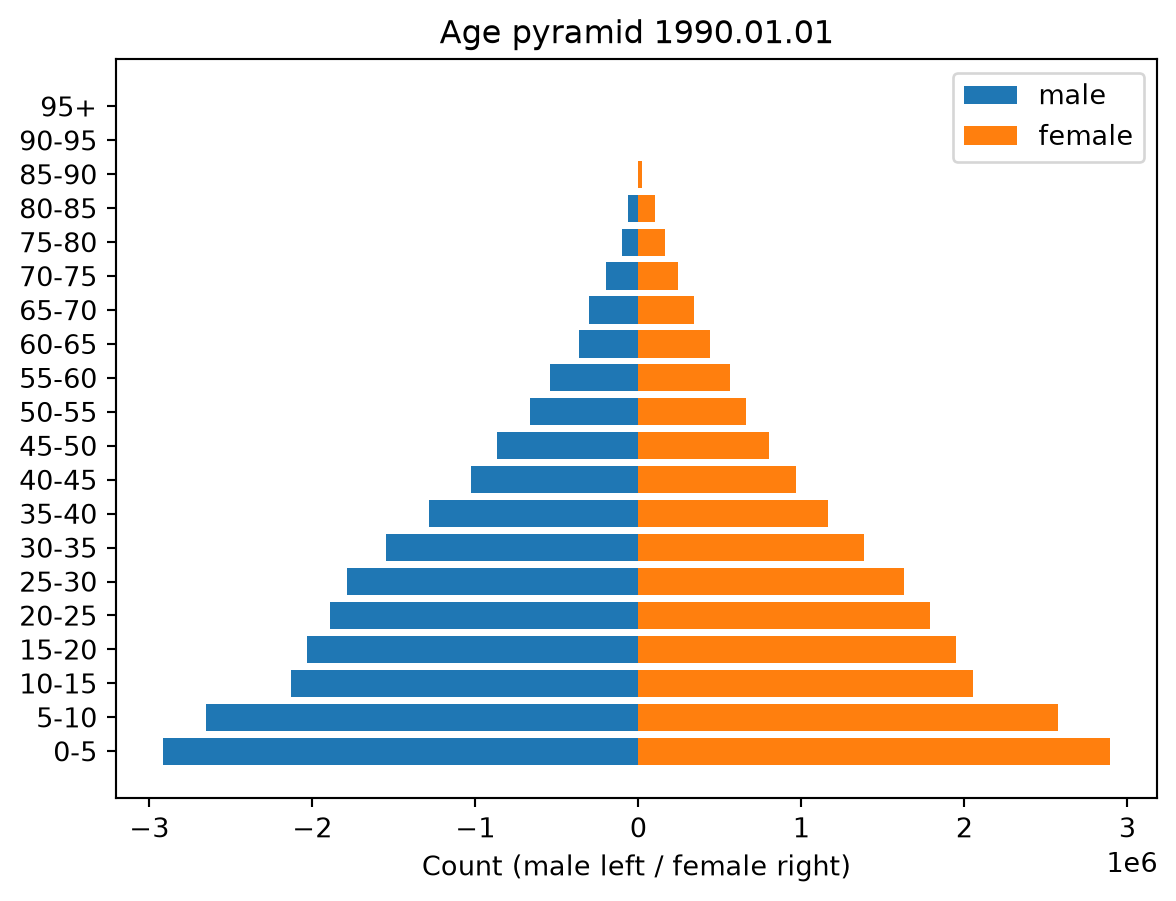
Never take the starting population on trust. The age_pyramid analyzer records the population by age and sex at the years you asked for:
To compare it against observed data, read the analyzer’s own table and the observed pyramid side by side. south_africa_age_pyramid.csv holds the UN figures for 1990:
A small systematic offset is expected here, because this CSV comes from an older population estimate than the bundled WPP 2024 data. What you are checking for is a bin off by a factor of two, or ratios that swing wildly between neighboring bins. Either means the starting population is wrong in a way that will distort everything downstream — most obviously cancer counts, which depend on how many women are alive at ages 40 to 60.
Look at the partnerships
Transmission happens over a two-layer heterosexual network: marital partnerships, which are long and have many acts, and casual partnerships, which are shorter and fewer. Both layers are held by one hpv.SexualNetwork module:
net = sim.networks.sexualnetworklayer_of_edge = np.asarray(net.edges.layer_id)print(f'Live partnerships at the end of the run: {len(net.edges.p1):,}')print(f' marital: {(layer_of_edge ==0).sum():,}')print(f' casual: {(layer_of_edge ==1).sum():,}')print('Median partnership length in years ''(sampled from the default parameters):')print(' marital:', round(float(np.median(net.pars.dur_pship_marital.rvs(1000))), 1))print(' casual: ', round(float(np.median(net.pars.dur_pship_casual.rvs(1000))), 1))print('Mean age at first sex, women:',round(float(np.mean(net.pars.debut_f.rvs(1000))), 1))
Live partnerships at the end of the run: 1,057
  marital: 886
  casual:  171
Median partnership length in years (sampled from the default parameters):
  marital: 72.0
  casual:  0.4
Mean age at first sex, women: 15.0
Note what those default durations say: marital partnerships last decades, so in practice they are lifelong, while casual partnerships last about six months. Sex acts are drawn per year — 80 on average in a marital partnership, 50 in a casual one — and are scaled down with age.
Those numbers are defaults, not evidence about your country. The full set — concurrent partner counts, acts per year, who pairs with whom by age, and the proportion of each age band that is partnered at all — is in hpv.NetworkPars. Print sim.networks.sexualnetwork.pars to see the values your run used, and expect to calibrate them.
Freeze the population and inspect it
hpv.snapshot takes a deep copy of the whole population at a moment you choose, which you can then examine however you like. It is unaffected by anything that happens later in the run: